Ask your business a question. Get the report.
Tau connects to the databases already behind your ERP, accounting, and sales systems and turns a plain question into a live dashboard, a paginated report, or a PDF in someone's inbox every Monday. No new data warehouse. No six-month BI project. Your data stays on your servers.
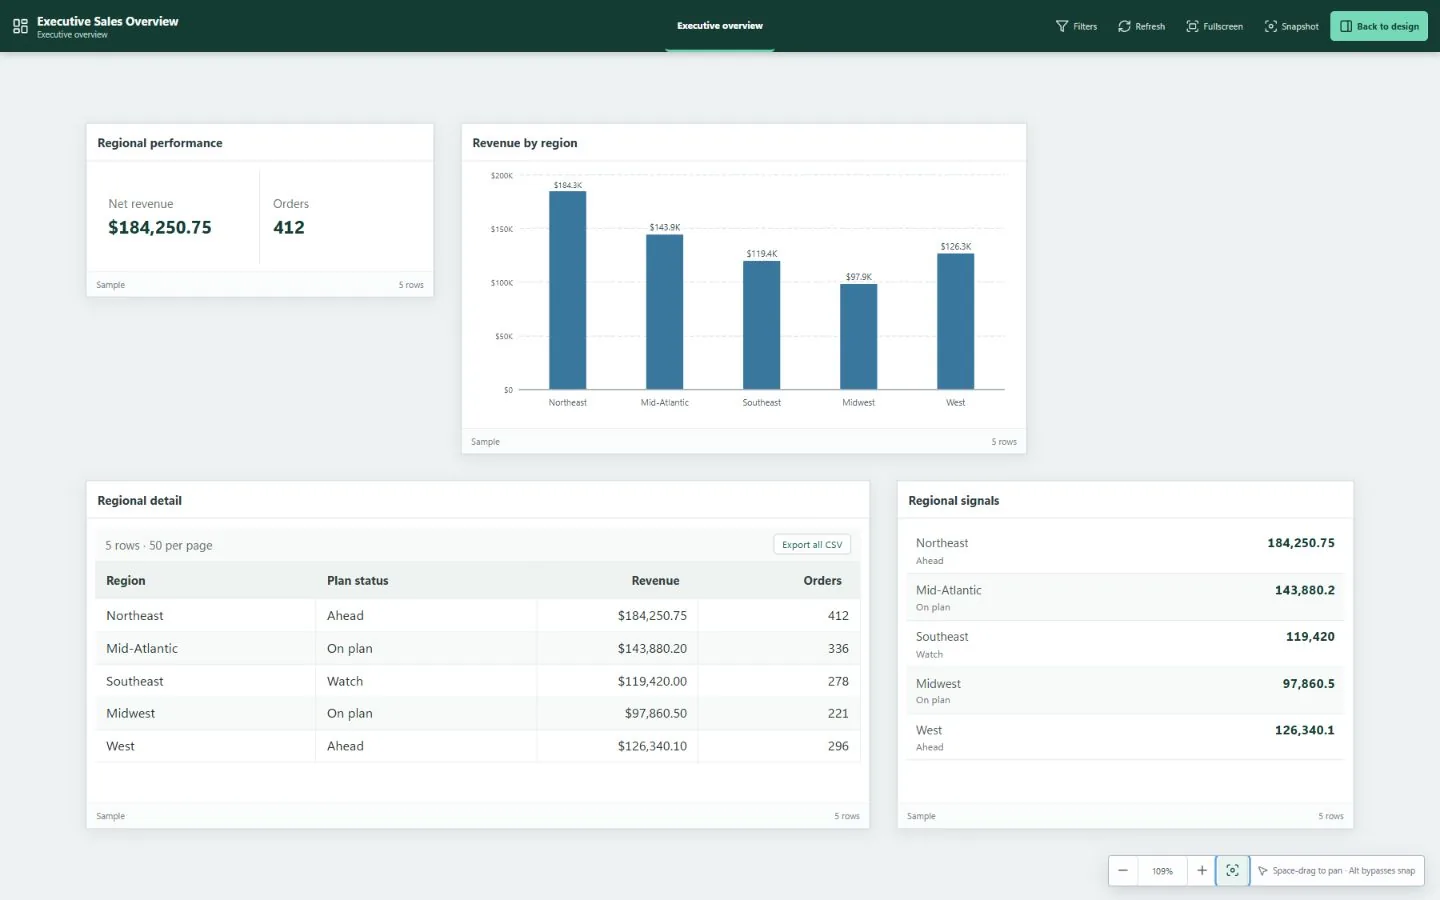
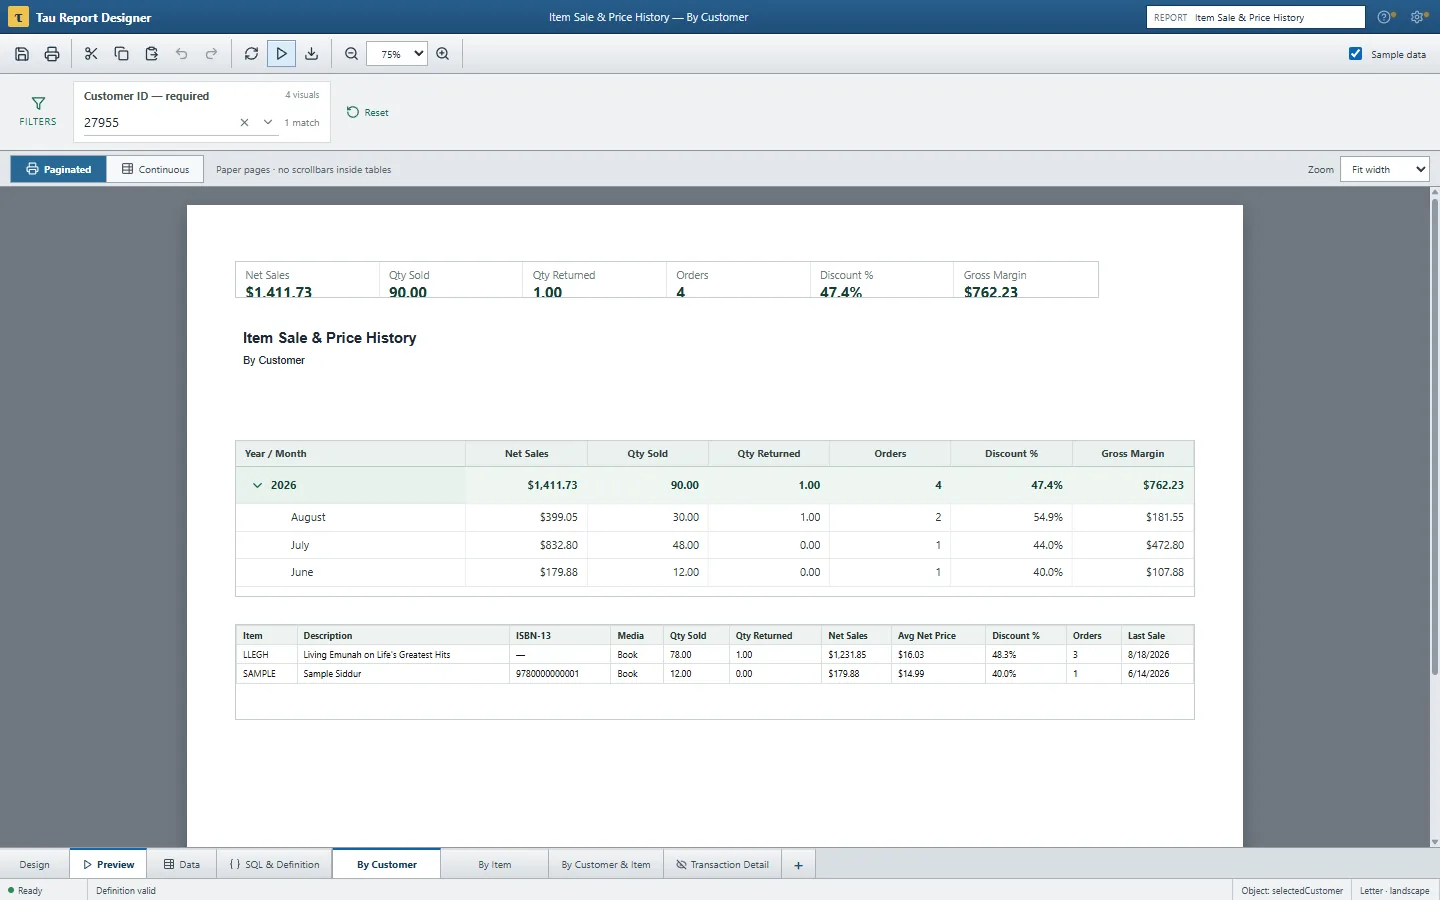
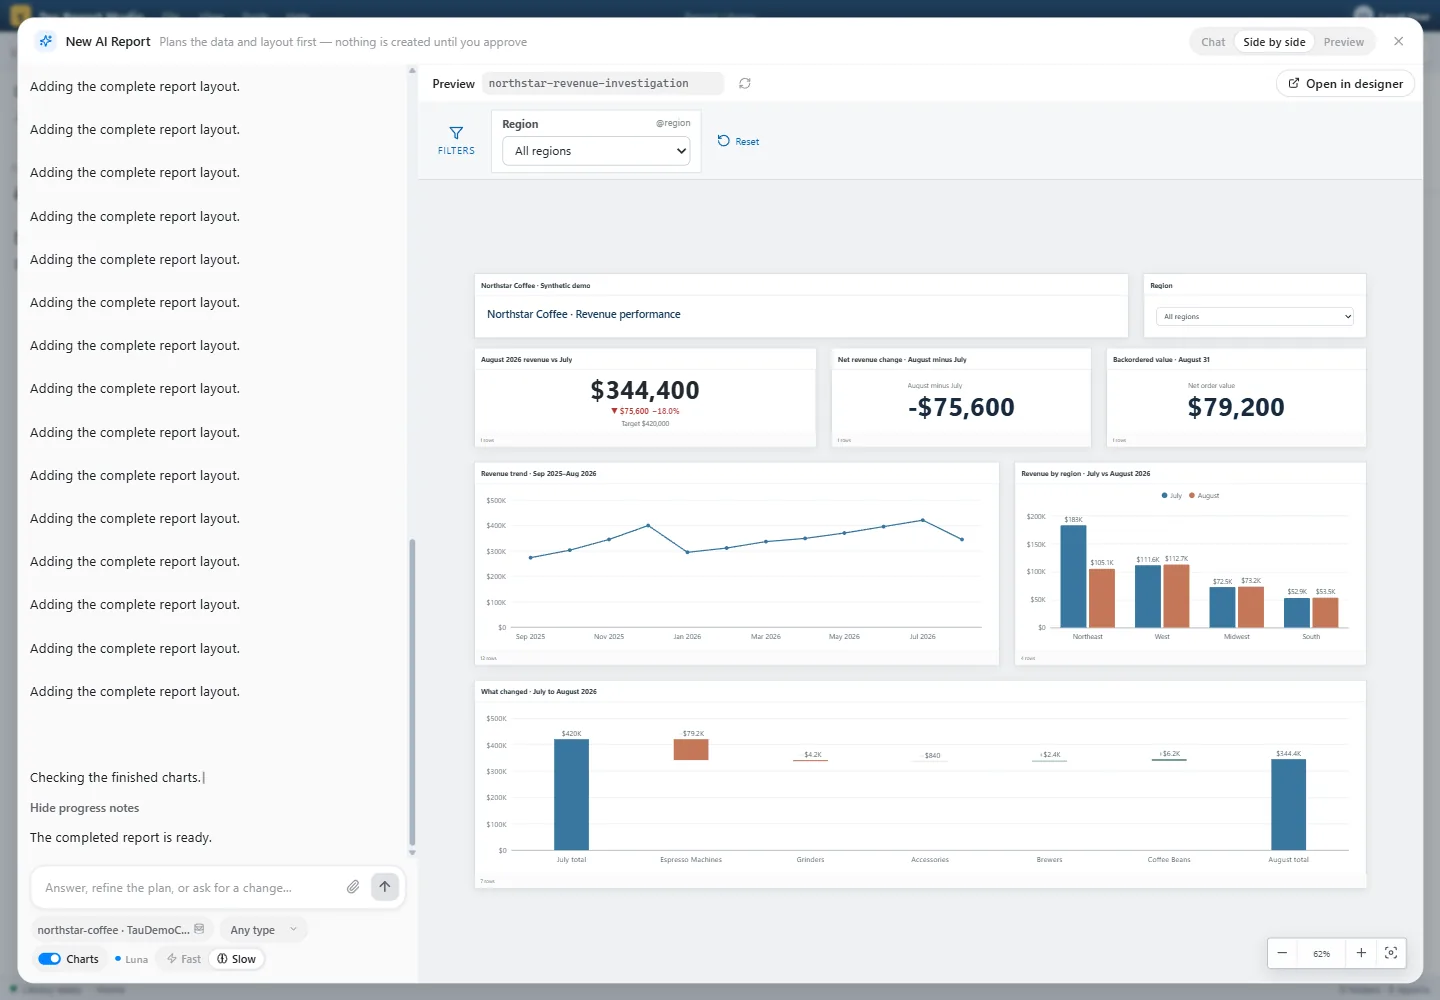
Answers today, reports your team already recognizes, and deliveries that happen without anyone asking.
Most reporting tools make you rebuild your business inside them first. Tau reads the systems you already run and gives you three things on day one.
Answers in minutes
Type "Why did revenue fall in August?" and get the number, the region and product behind it, and the evidence. When the answer deserves a report, one more sentence turns it into one.
Reports people recognize
Live dashboards for screens. Paginated reports for printing and PDF, laid out exactly the way your team expects them. Both from the same source, both always current.
Delivered on a schedule
Every rep gets their own open-orders PDF Monday at 7. Every customer gets their statement on the first. Finance gets the aged balance as Excel that still adds up. Set it once.
One report can be a dashboard on Monday and a paginated report on Friday.
A dashboard tab is for looking: KPI cards, charts, sortable tables, filters that narrow everything at once. A paginated tab is for printing: exact paper size, repeated headers, group totals, page numbers, a clean PDF. Put both in the same report and they read from the same data.
Paginated: built for paper
Sections, rulers, fields, groups, formulas, running totals, barcodes, subreports. Statements, invoices, pick lists, and month-end packs come out the same on every page, every time.
Dashboard: built for the screen
Drag fields onto a canvas, pick a chart, set the format, add a filter. Cards, tables, matrices, and more than twenty chart types are built in.
Both in one report
Start on a dashboard, right-click a number, and land on the paginated detail behind it. Press Back and the dashboard is exactly as you left it.
It answers first. It only builds a report when you say so.
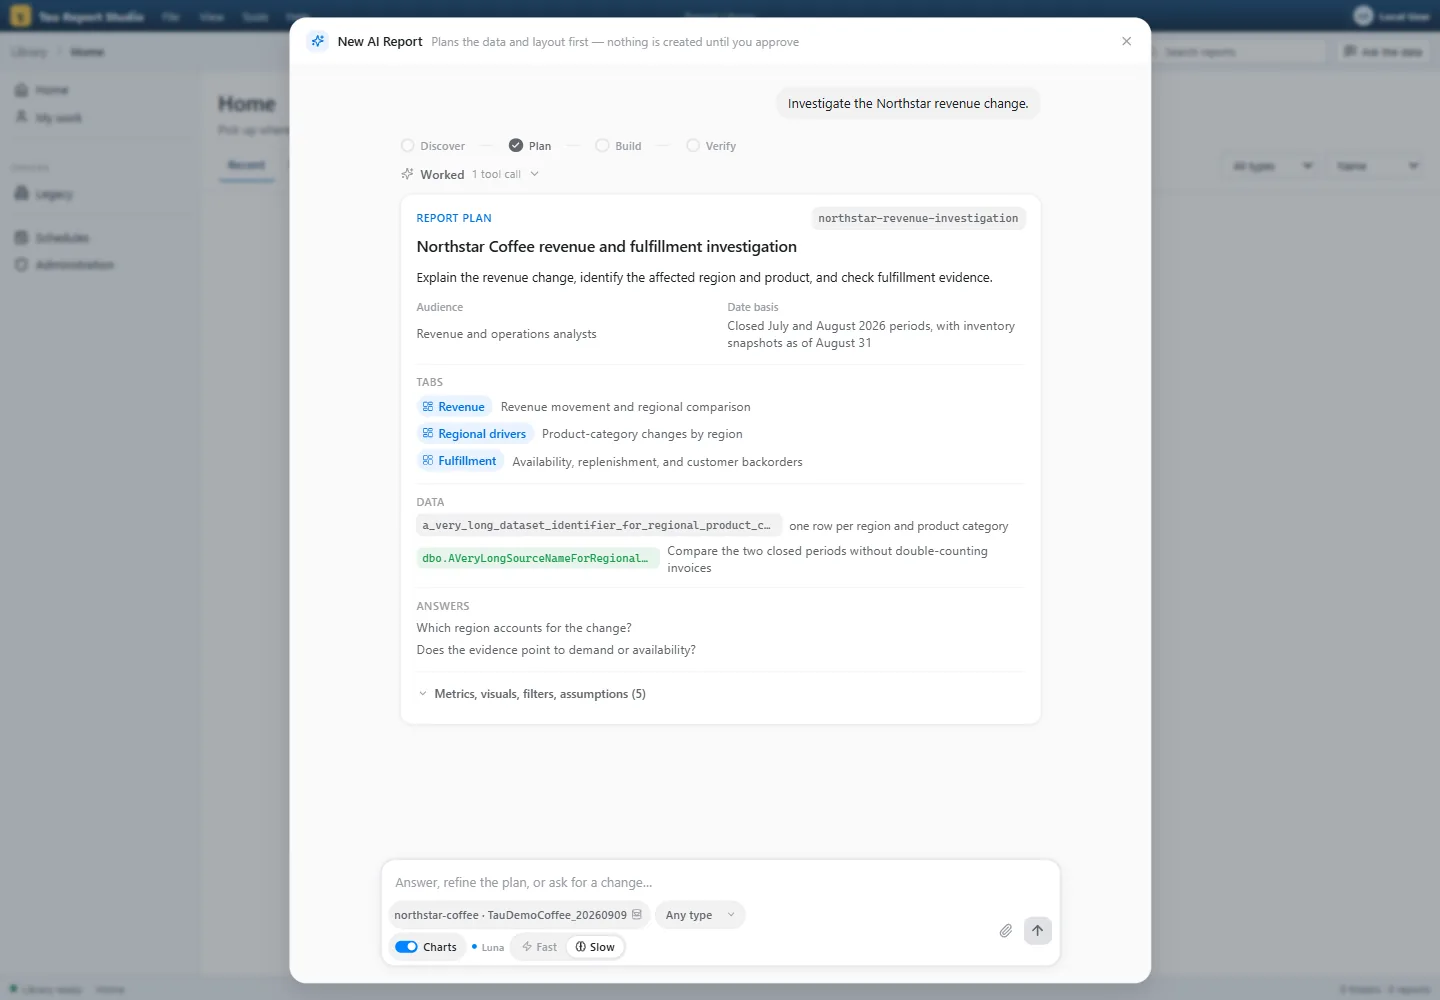
Ask in plain language. Tau looks at your actual data, answers with the figures and the reason behind them, and tells you where the numbers came from. When you want that answer as a report, it writes a one-page plan first: who it is for, which period, which tabs, which questions each tab answers. You approve the plan. Then it builds.
- Plain language, or technical. Choose how it talks to you: plain answers for managers, the full detail for analysts.
- Knows your definitions. Tell it once that revenue means posted invoices excluding tax. Every later answer respects it.
- Nothing silent. The report it builds is the same kind your team builds by hand. Open it, change it, print it.
- Your AI provider, your account. Works with the AI service your company already approves, on your own key.
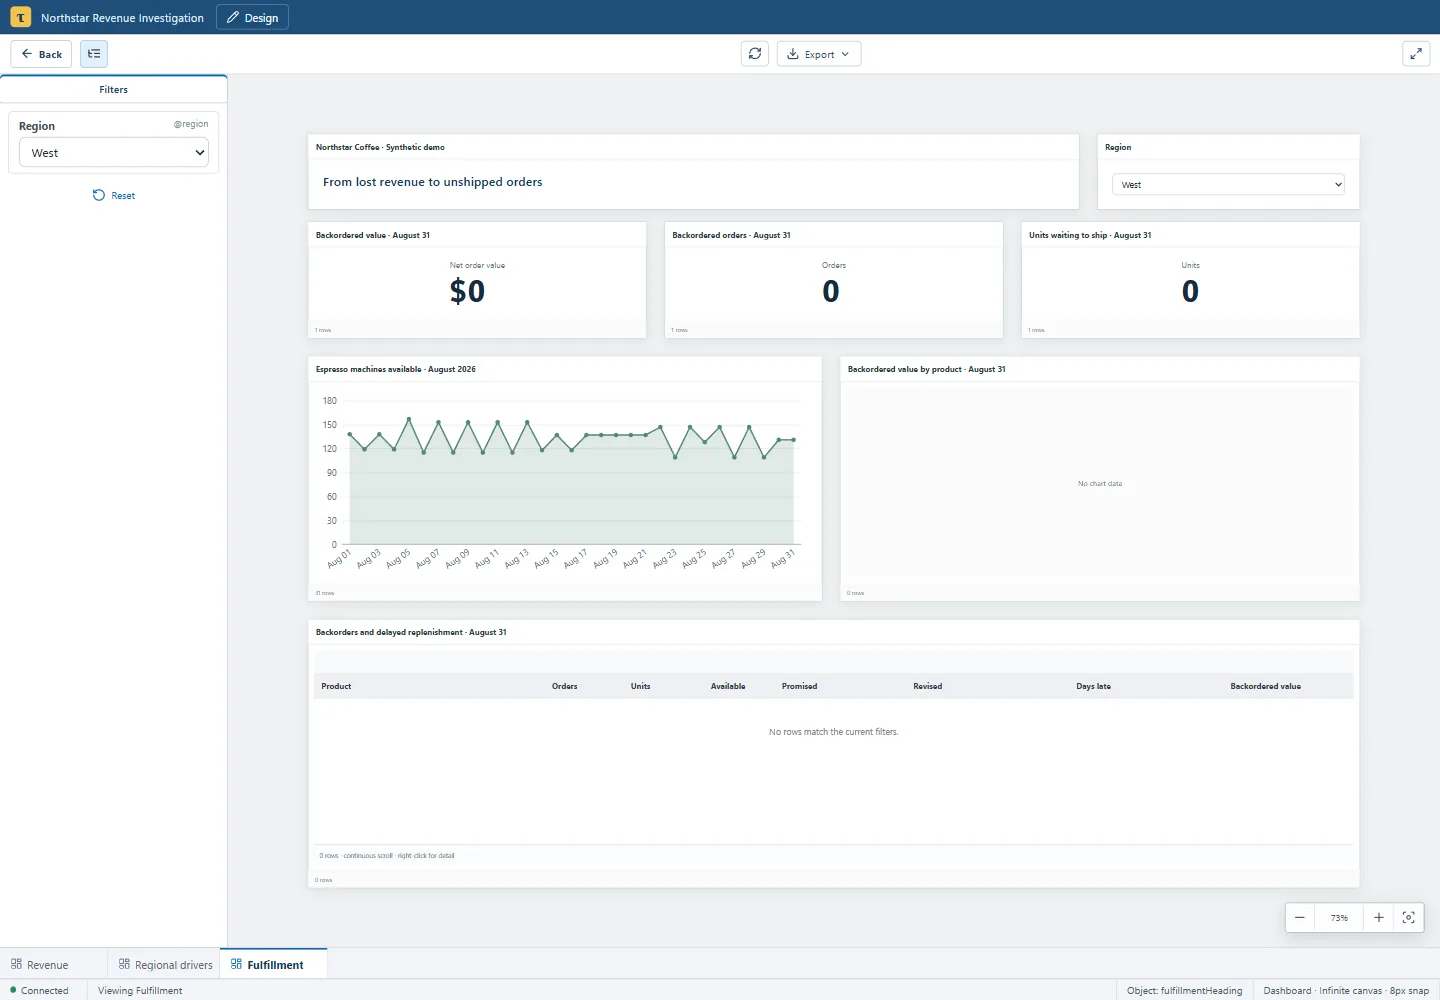
From a total on a chart to the thirty orders behind it, in two clicks.
A number on a dashboard is only useful if you can see what is inside it. Right-click a bar, a row, or a card and Tau opens the orders, customers, or invoices that make it up, with your filters carried along. Go back and the report is exactly as you left it.
- Filters that mean it. Pick a region or a customer and every chart and table on the page narrows to it, all the way down to the records.
- Tables built for real volumes. Sort, filter each column, see totals and subtotals, and export every row to Excel or CSV.
- Excel that still adds up. Totals arrive as live formulas, not pasted values, so finance can keep working in the sheet.
No migration. No new logins to manage. Nothing leaves your building unless you send it.
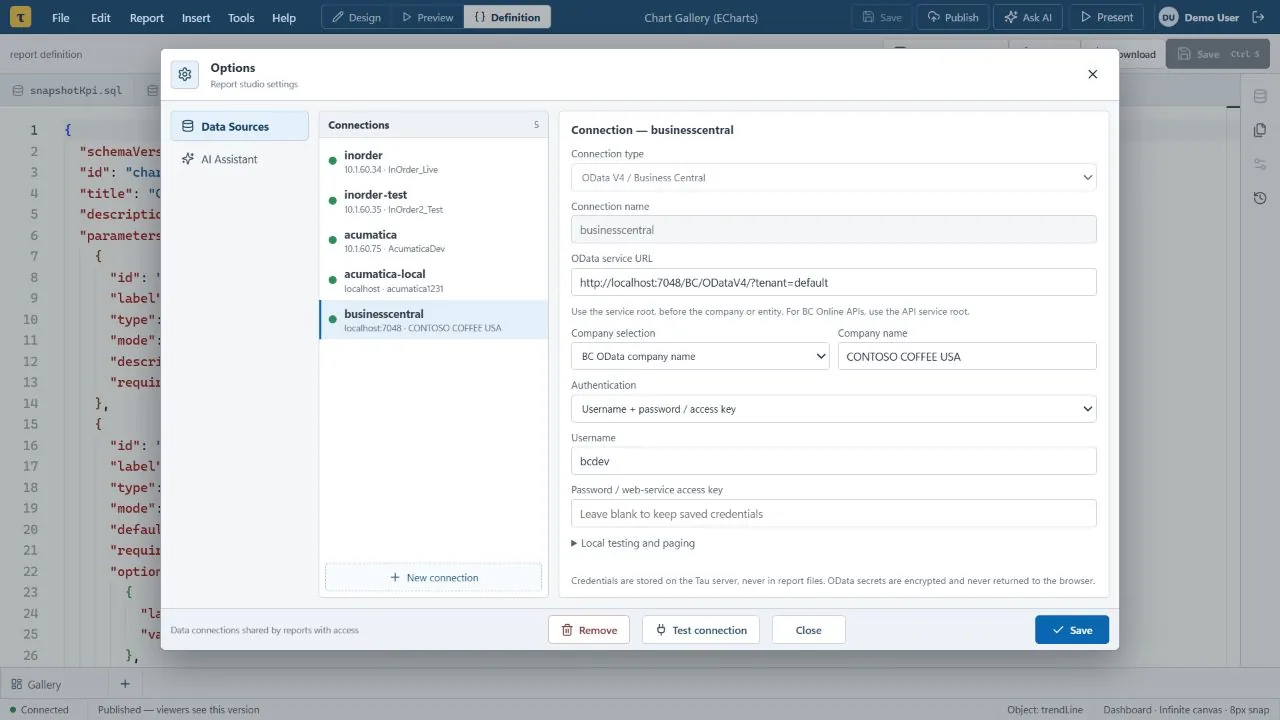
Tau reads directly from the SQL Server databases behind your ERP and accounting systems, with a read-only login your IT team controls. Install it on a server you own, sign in with your Microsoft accounts, and decide who sees what.
Your existing systems
Connects to any number of SQL Server databases, and to Business Central and other cloud systems that publish their data. Combine an old system and a new one in the same report during a migration.
Read-only by design
Tau never writes to your business systems. The database login it uses can only read, and it lives with IT, not inside reports.
The right people see the right reports
Sign in with Microsoft. Organize reports into spaces, share with people or groups, and publish a version viewers see while you keep editing the next one.
Set and forget deliveries
Schedule a report daily, weekly, or on the first business day. Send one PDF to a list, or one per customer, rep, or location, each with only their rows.
Honest about what is finished
Anything in Tau that is not finished is greyed out and says so. You will not find a button that looks like it works and does nothing.
Made for the long haul
Every report is kept as readable files with a full version history, so nothing is trapped in a proprietary workbook and any change can be undone. Your IT team can back them up, review them, and move them like any other files.
One business question, from "why?" to a finished report. Two minutes.
Recorded on Tau against a demo company's live database. Waiting time is trimmed; nothing else is staged.
What reports look like when they come out of Tau.
Northstar Coffee is a made-up coffee distributor with six years of orders, invoices, shipments, payments, purchasing, and inventory in a real database. These reports were built on it. To work with them yourself, open the demo from the button at the top of the page.
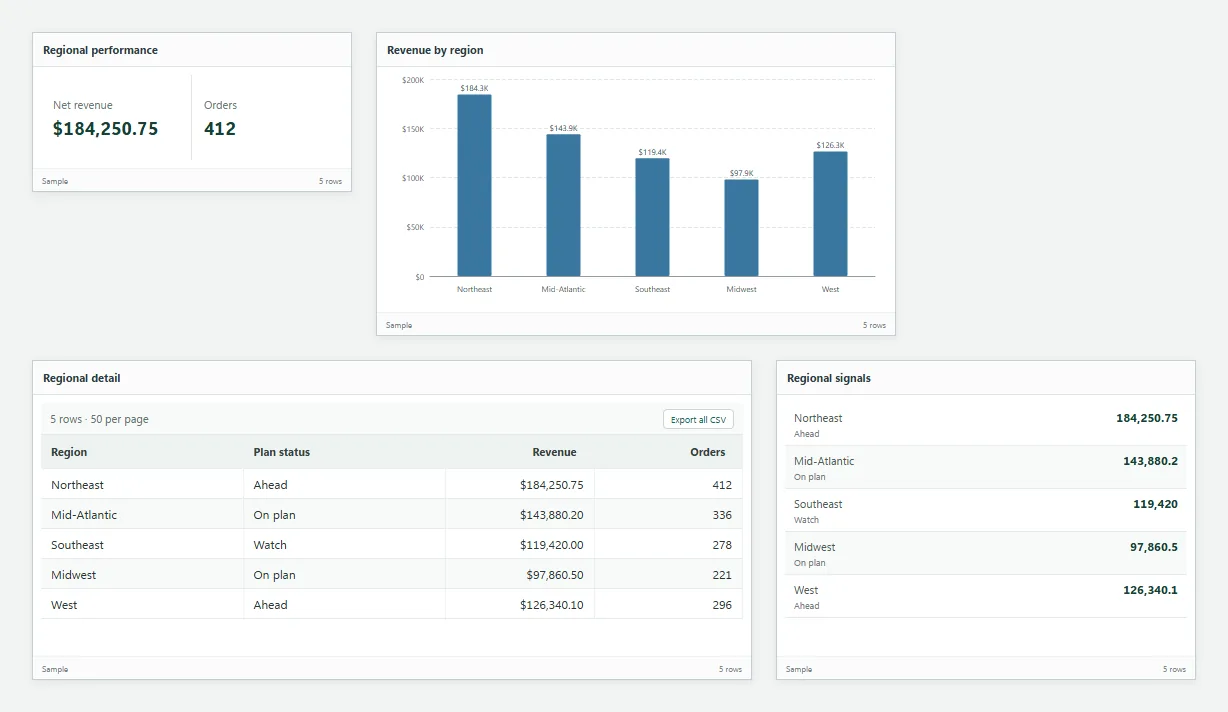
The demo is a shared instance that resets nightly, is available in the United States, and asks visitors to pass a quick check before it opens.
Runs on a server you own. Reads only what you allow.
Tau installs as a single service on Windows or Linux, or as a container. It needs a read-only SQL Server login and, optionally, your Microsoft sign-in and a mail sender for deliveries. Reports are plain files with version history, so they back up, review, and restore like anything else.